
Fourteen ways to get better at reading your own data
Every programme below is delivered hands-on, in a highly simplified style, so participants leave able to use what they learned the very next day. Click any course to email us directly and ask about dates, group rates, or a custom in-house run.
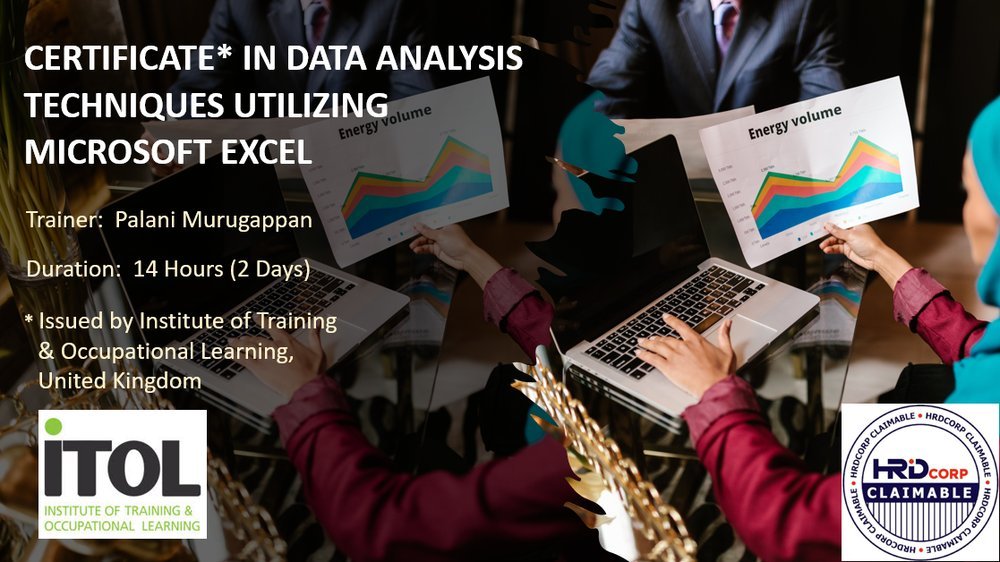
Data Analysis with Microsoft Excel (UK Certification)
A two-day, internationally certified foundation in using Excel to clean, structure and analyse real business data — a benchmark you can put straight on your CV.
Enquire about this course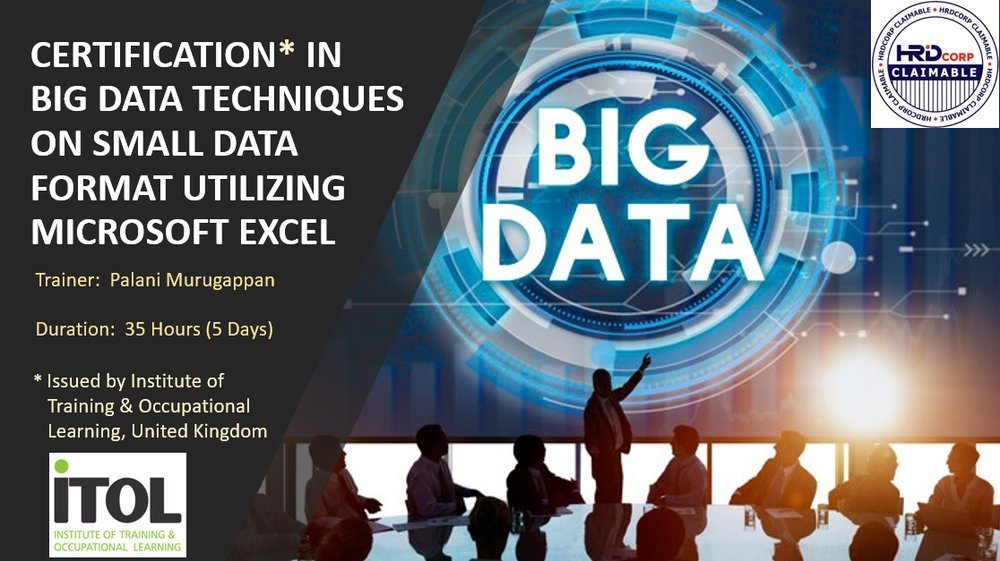
Big Data Analysis with Microsoft Excel (UK Certification)
A deeper, five-day UK-certified track for teams handling larger, messier datasets who need advanced Excel techniques to turn volume into clarity.
Enquire about this course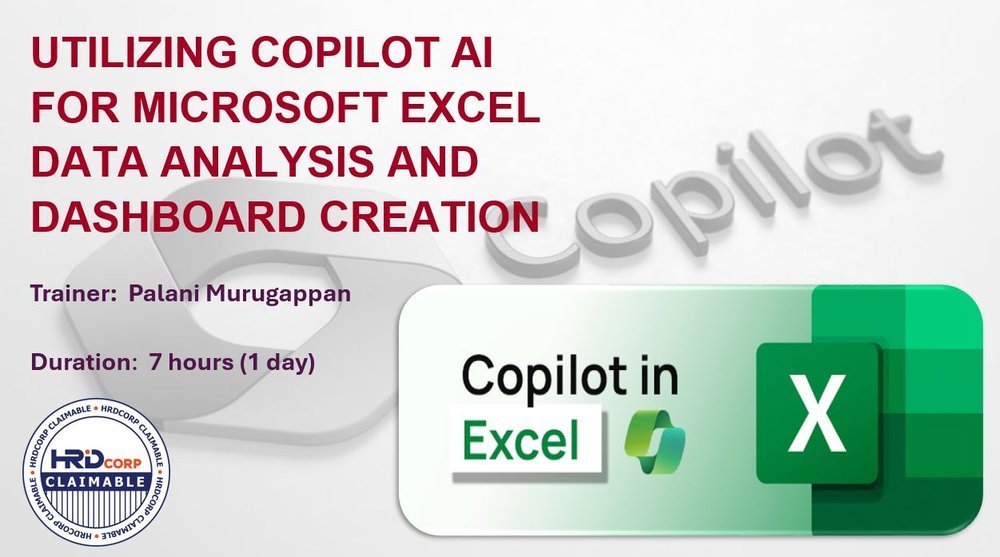
Data Analysis & Dashboards with Microsoft Copilot
Learn to pair Excel with Microsoft Copilot to speed up analysis and build dashboards that update and explain themselves, without sacrificing accuracy.
Enquire about this course
Everyday Office Efficiency with Microsoft Copilot
Practical ways to use Copilot across your daily Office tasks so routine work takes minutes instead of hours — without losing control of the details.
Enquire about this course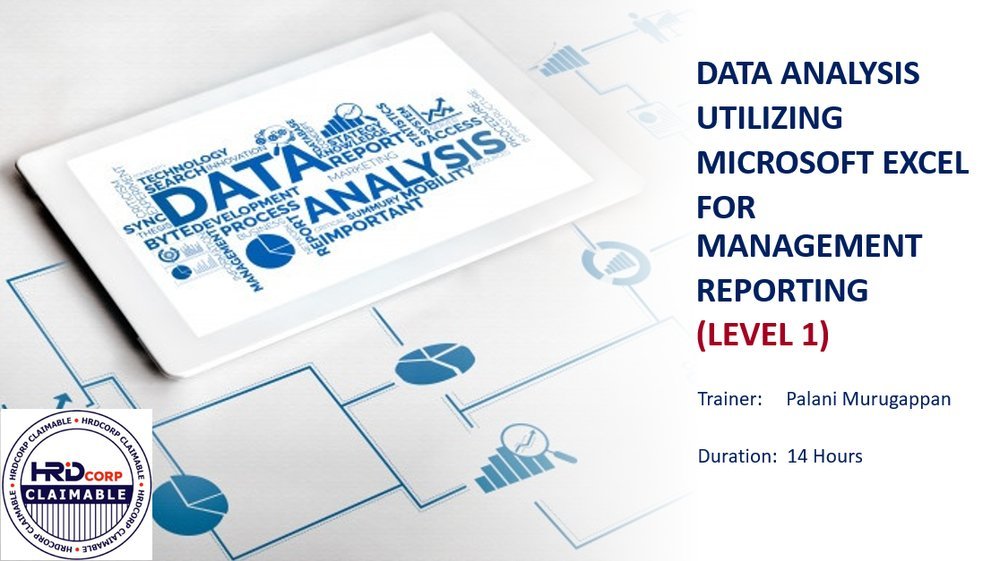
Excel Level 1: Building Real Confidence with Spreadsheets
For anyone who wants Excel to finally make sense — core skills, built from the ground up, with no assumed prior knowledge.
Enquire about this course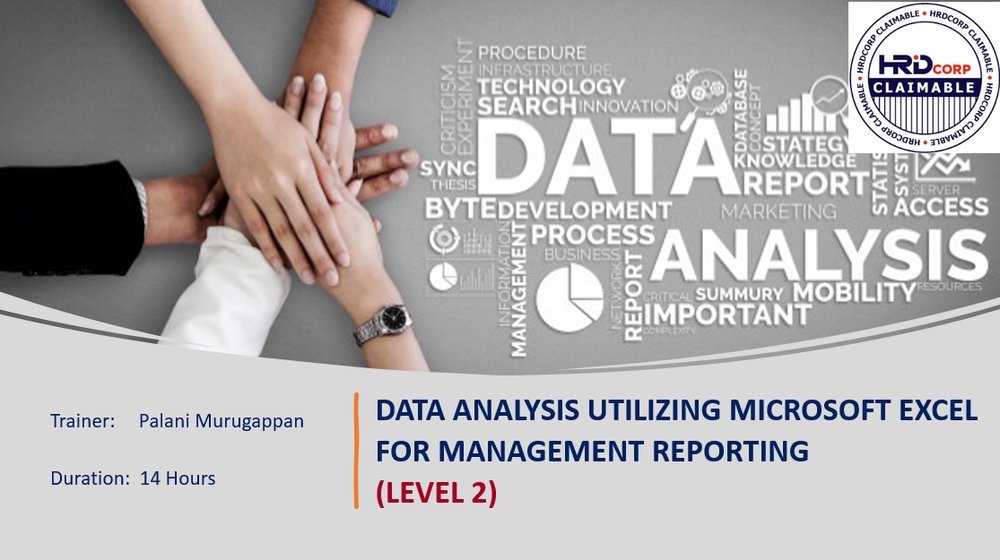
Excel Level 2: Formulas, Functions & Faster Work
Move beyond the basics into formulas, functions and shortcuts that turn hours of manual work into minutes.
Enquire about this course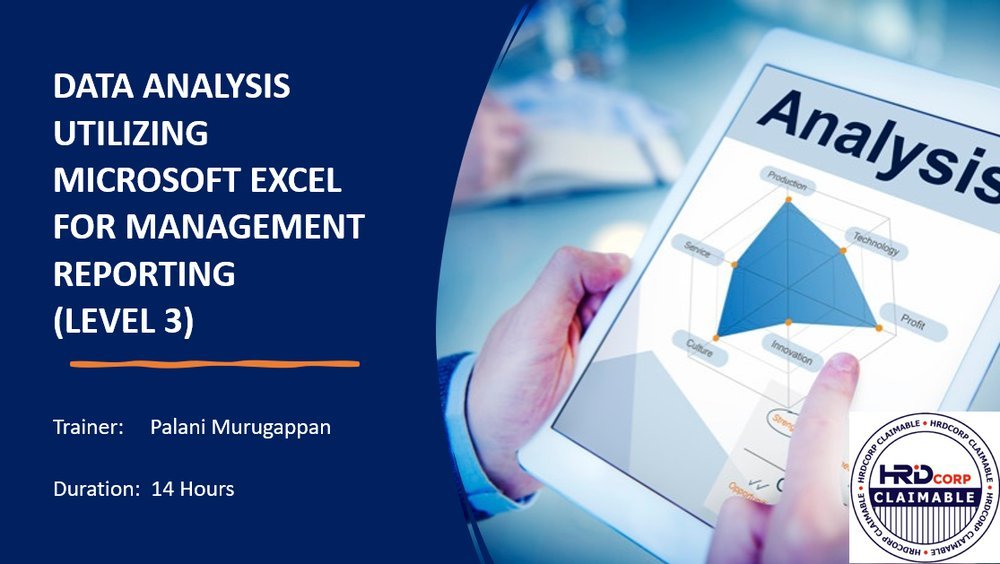
Excel Level 3: Advanced Analysis for Complex Data
Advanced tools and techniques for participants ready to handle large, layered datasets and deliver sharper, board-ready analysis.
Enquire about this course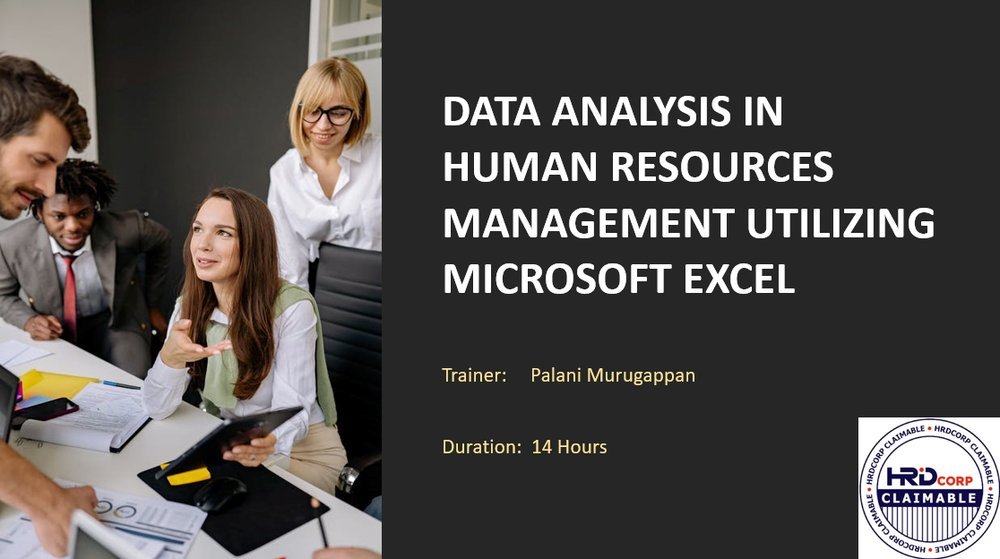
Excel for Human Resource Management
Purpose-built for HR teams: tracking, analysing and reporting on headcount, compensation and workforce data with confidence.
Enquire about this course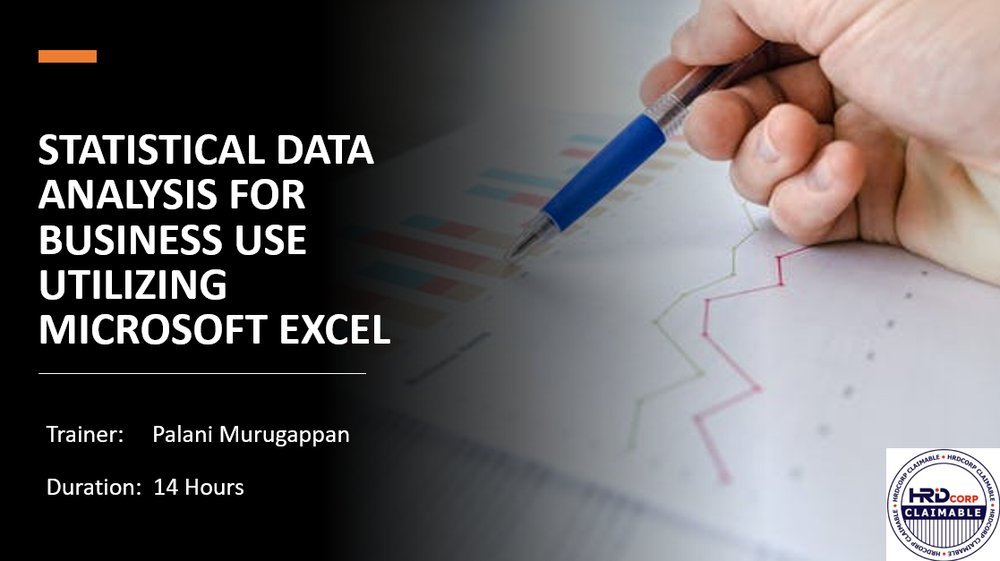
Excel for Statistics & Business Analysis
Apply statistical thinking to everyday business questions using Excel's analysis tools — built for decisions, not just for exams.
Enquire about this course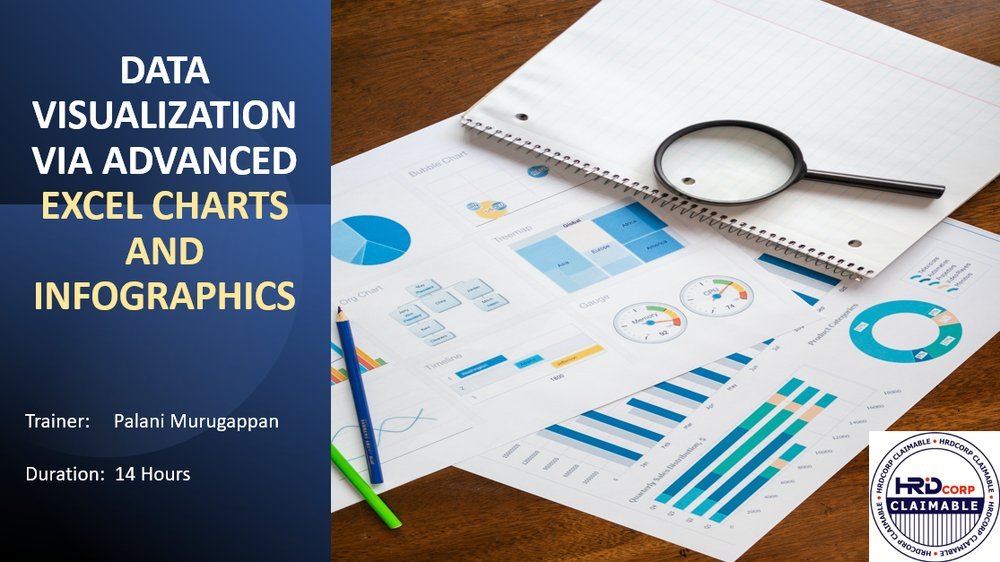
Excel Charts & Infographics
Turn dense tables into charts and infographics that a busy executive can understand in the time it takes to glance at a slide.
Enquire about this course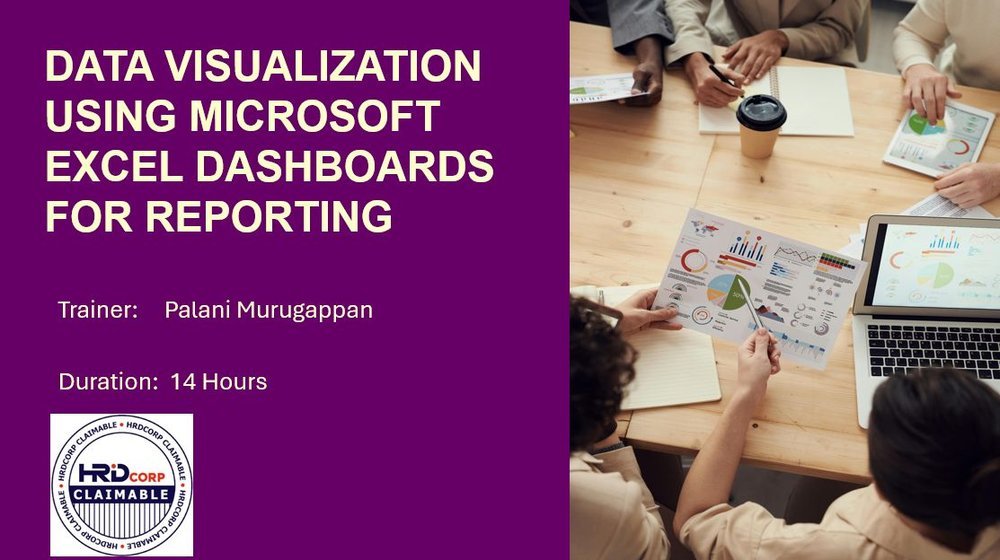
Building Excel Dashboards
Design interactive, at-a-glance dashboards that pull the right numbers to the surface the moment new data comes in.
Enquire about this course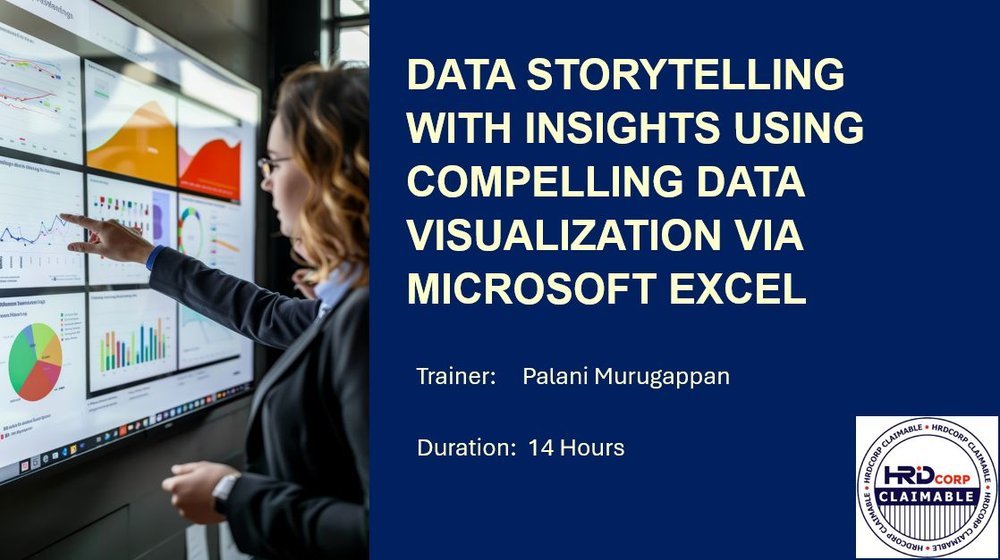
Data Storytelling
The techniques for presenting numbers as a narrative people remember — because a chart nobody understands changes nothing.
Enquire about this course
Powerful PowerPoint Presentations
Build presentations that hold a room's attention and make your data-backed argument impossible to ignore.
Enquire about this course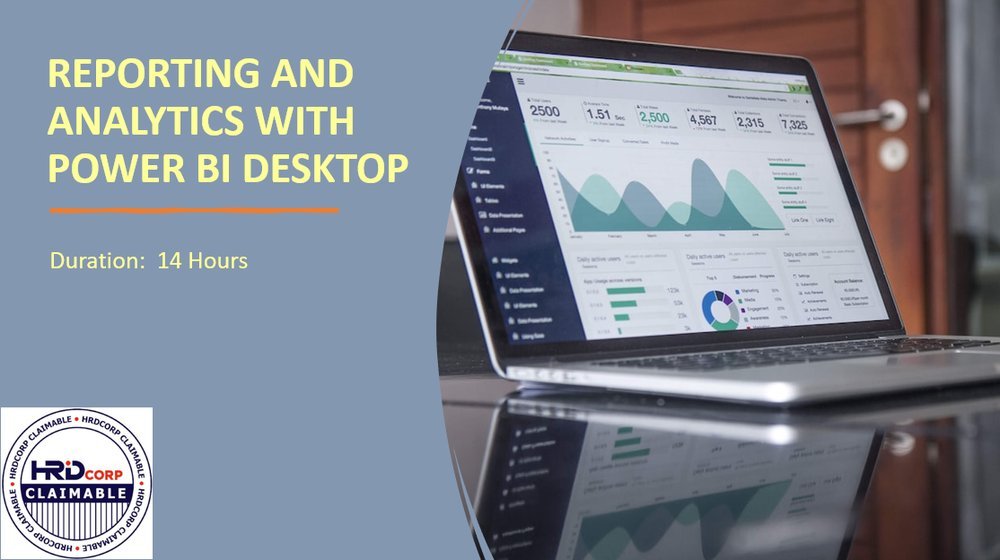
Power BI Essentials
Get hands-on with Power BI to build live, shareable reports that go further than a static spreadsheet ever could.
Enquire about this course
Not sure which course fits your team?
Tell us what your team is trying to get better at, and we'll point you to the right programme — or design one around your data.
Ask us a question